The problem, and the shape of the answer
A business spending in the order of two billion dollars a year on operating cost cannot answer “where are we against budget, and where will we land?” from a spreadsheet. Before this platform, that answer took days. Material variances were investigated by exporting ERP extracts, joining them by hand to a budget structure that lived somewhere else, and circulating a workbook that was out of date the moment it was sent.
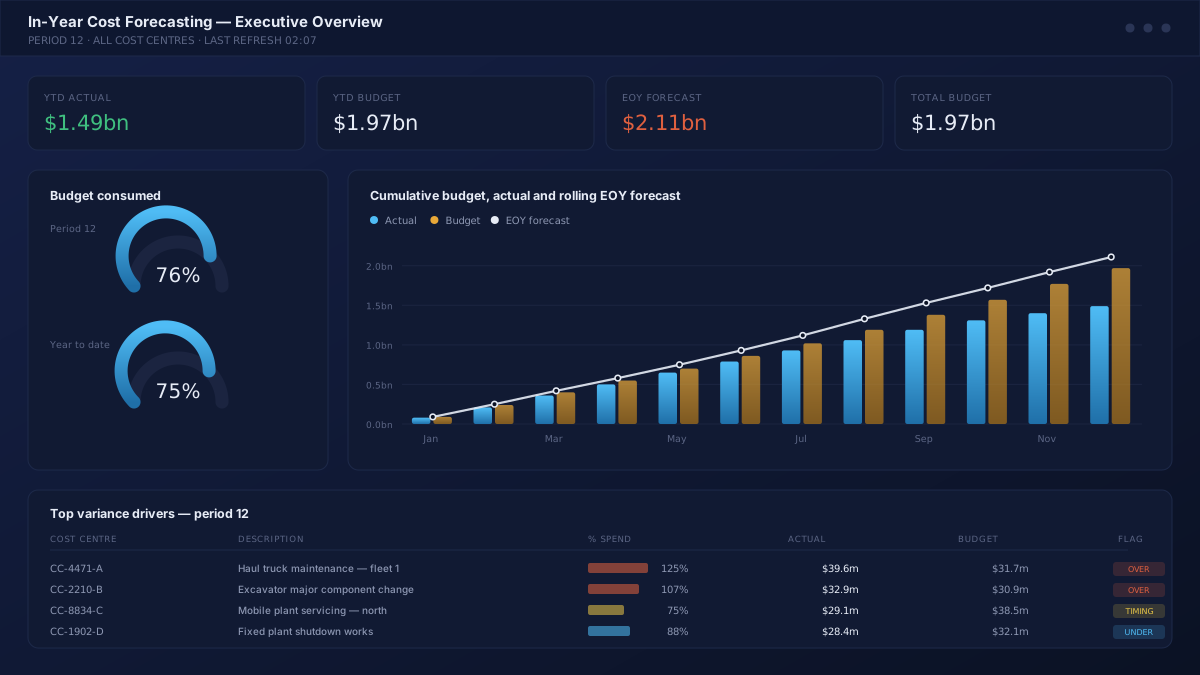
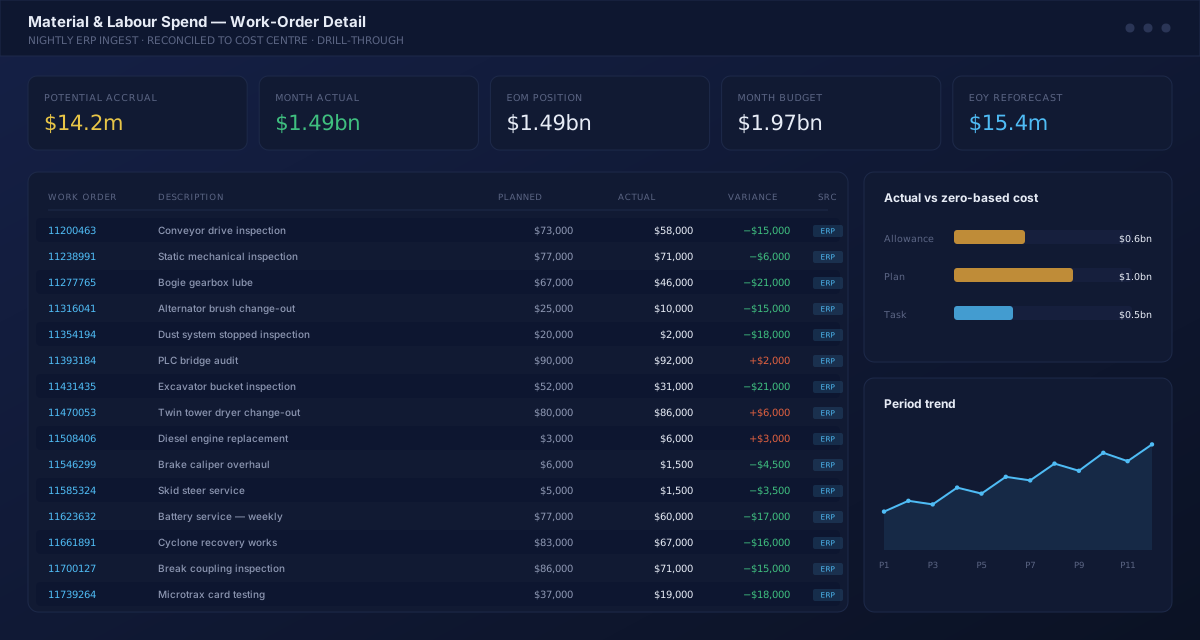
The In-Year Cost Forecasting Platform replaces that cycle with a single governed model. Work-order-level material and labour spend is ingested nightly from SAP, reconciled to the cost centre and budget structure, and surfaced alongside a rolling end-of-year forecast with the variance drivers already attributed and colour-coded.
The critical design decision was to serve three very different audiences from one semantic model rather than three disconnected reports. An executive sees the year-end position and the four cost centres moving it. A planner sees the work orders behind a variance. A cost-centre owner sees only their own ledger, with the same numbers, reconciled the same way. When the model updates, all three update together — there is no version of the truth that lags.
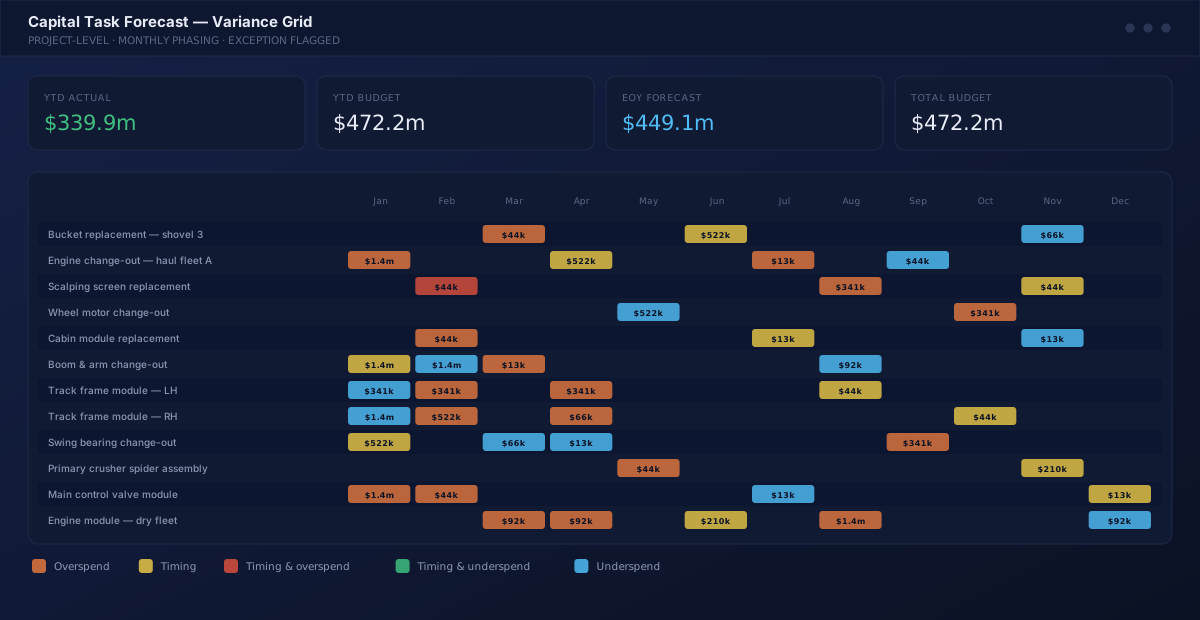
Just as important is what the platform separates out. Not every variance is a problem: a change-out that slipped a month reads identically to genuine overspend in a raw budget report. The forecast engine distinguishes timing from quantum at the task level, so the exceptions that reach a review meeting are the ones that actually need a decision.
What it does
Nightly ERP reconciliation — Work-order-level material and labour spend ingested from SAP and reconciled to cost centre and budget structure without manual intervention
Rolling end-of-year forecast — Continuously reforecast landing position rather than a fixed annual number, updated with every refresh
Attributed variance drivers — Variances are decomposed and ranked, so the review conversation starts from the cause rather than the total
Timing versus quantum separation — Deferred work is flagged distinctly from genuine overspend, cutting false positives out of exception review
Single semantic model — Executive summary, planner detail and cost-centre-owner drill-through all resolve against one governed definition of every measure
Cost-centre-owner drill-through — Owners see their own ledger down to work order, with the same reconciliation logic as the executive view
Capital task phasing — Month-by-month capital forecast with automatic colour-coded exception flagging at the task level
Accrual position — Potential accrual and end-of-month position surfaced alongside actuals so period-close is not a surprise
Row-level security — Access scoped to organisational structure so the same report serves every level of the business safely
Audit trail to source — Every figure traces back to the originating work order and ERP document
How it is built
Data platform
Semantic layer
Forecasting
Delivery
Engineering
What changed
Refresh cadence moved from monthly to daily. Time-to-explanation for a material variance collapsed from days to hours — the work order behind a movement is now two clicks from the executive summary rather than a request to a planner and a wait.
The wider effect was on the shape of the review meeting. When every participant is holding a different spreadsheet, the first half of a cost review is spent agreeing whose number is right. With a single reconciled model, that argument disappears and the conversation starts at the decision.
The platform manages roughly $2bn of operating budget across more than 100 cost centres, and the same pattern — governed semantic layer, nightly reconciliation to source, exception-first presentation — transfers directly to any business with a large, distributed cost base and a demanding reporting cycle.